
Data Analytics
TeacherEase provides data analytics software to support standards-based learning (SBL). You can hold all learning data in one place. Store and analyze data from common summative assessments, external benchmarks, and formative assessments. Powerful tools help educators make thoughtful decisions. Generate analysis quickly and create timely action plans. Inform instruction and be responsive to student learning.
BENEFITS
Store and analyze learning data at scale
Use analytics to make decisions to benefit education
Hold all performance data in one system
Generate results quickly and impact instruction
Usable by district staff and individual teachers
Make instruction responsive to student learning
Create a culture of thoughtful decision-making based upon data
Handles common summatives, external benchmarks, and formative assessments
Want to Talk?
Request DemoSchool- or District-wide Accounts
Group PricingFEATURES
Capture and analyze all learning data in one place
Most districts get assessment data from a number of sources, and TeacherEase can hold and analyze it all. There’s a benefit to keeping it in one place.
Analyze external benchmark data
Most organizations get student performance data from large assessment services (NWEA MAP, AimsWeb, etc) and state-mandated tests (PARCC, SBAC, etc). Many struggle to generate timely actionable analysis. TeacherEase can help analyze this data, making it useful.
Supports common summative assessments
Most districts build common summative assessments. They are given organization-wide and measure student performance using targets specific to local curricula. Get analysis fast and create action plans to improve student mastery.
Teachers use formative assessment data
During regular instruction, teachers give quick checks to understand student mastery. Make instruction more relevant and responsive to learning. Help teachers use data more frequently. Build a culture of thoughtful decision-making based upon data.

Run reports and graphs to understand performance
The analytics engine outputs interactive graphs and tabular reports. Users choose a population, report type, and filters to easily visualize data. For every graph, drill down and identify the students in each group.
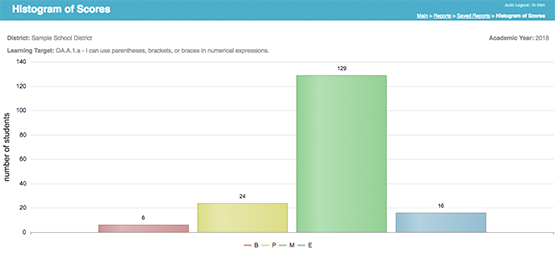
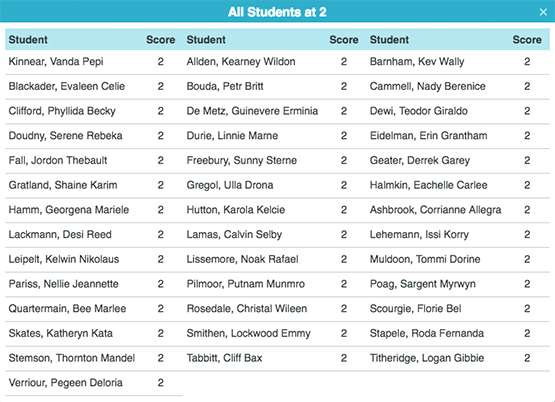
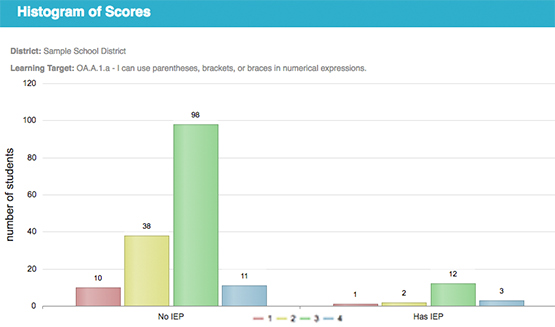
Histograms of student mastery
The simplest report is a histogram of student mastery. Choose a population of students (section, course, school, entire district) and break them into groups based upon mastery. Hover to see students in each histogram bucket. This information is useful to: identify groups of student in need additional assistance, form dynamic groups for instruction, measure effectiveness of instructional techniques, support a data-driven culture of decision-making, etc.
Analyze individual learning targets or the entire course
Reporting can be run for individual learning targets, or aggregated to understand progress through an entire course. Control the granularity of analysis to zoom in on specific topics, or zoom out for large trends.
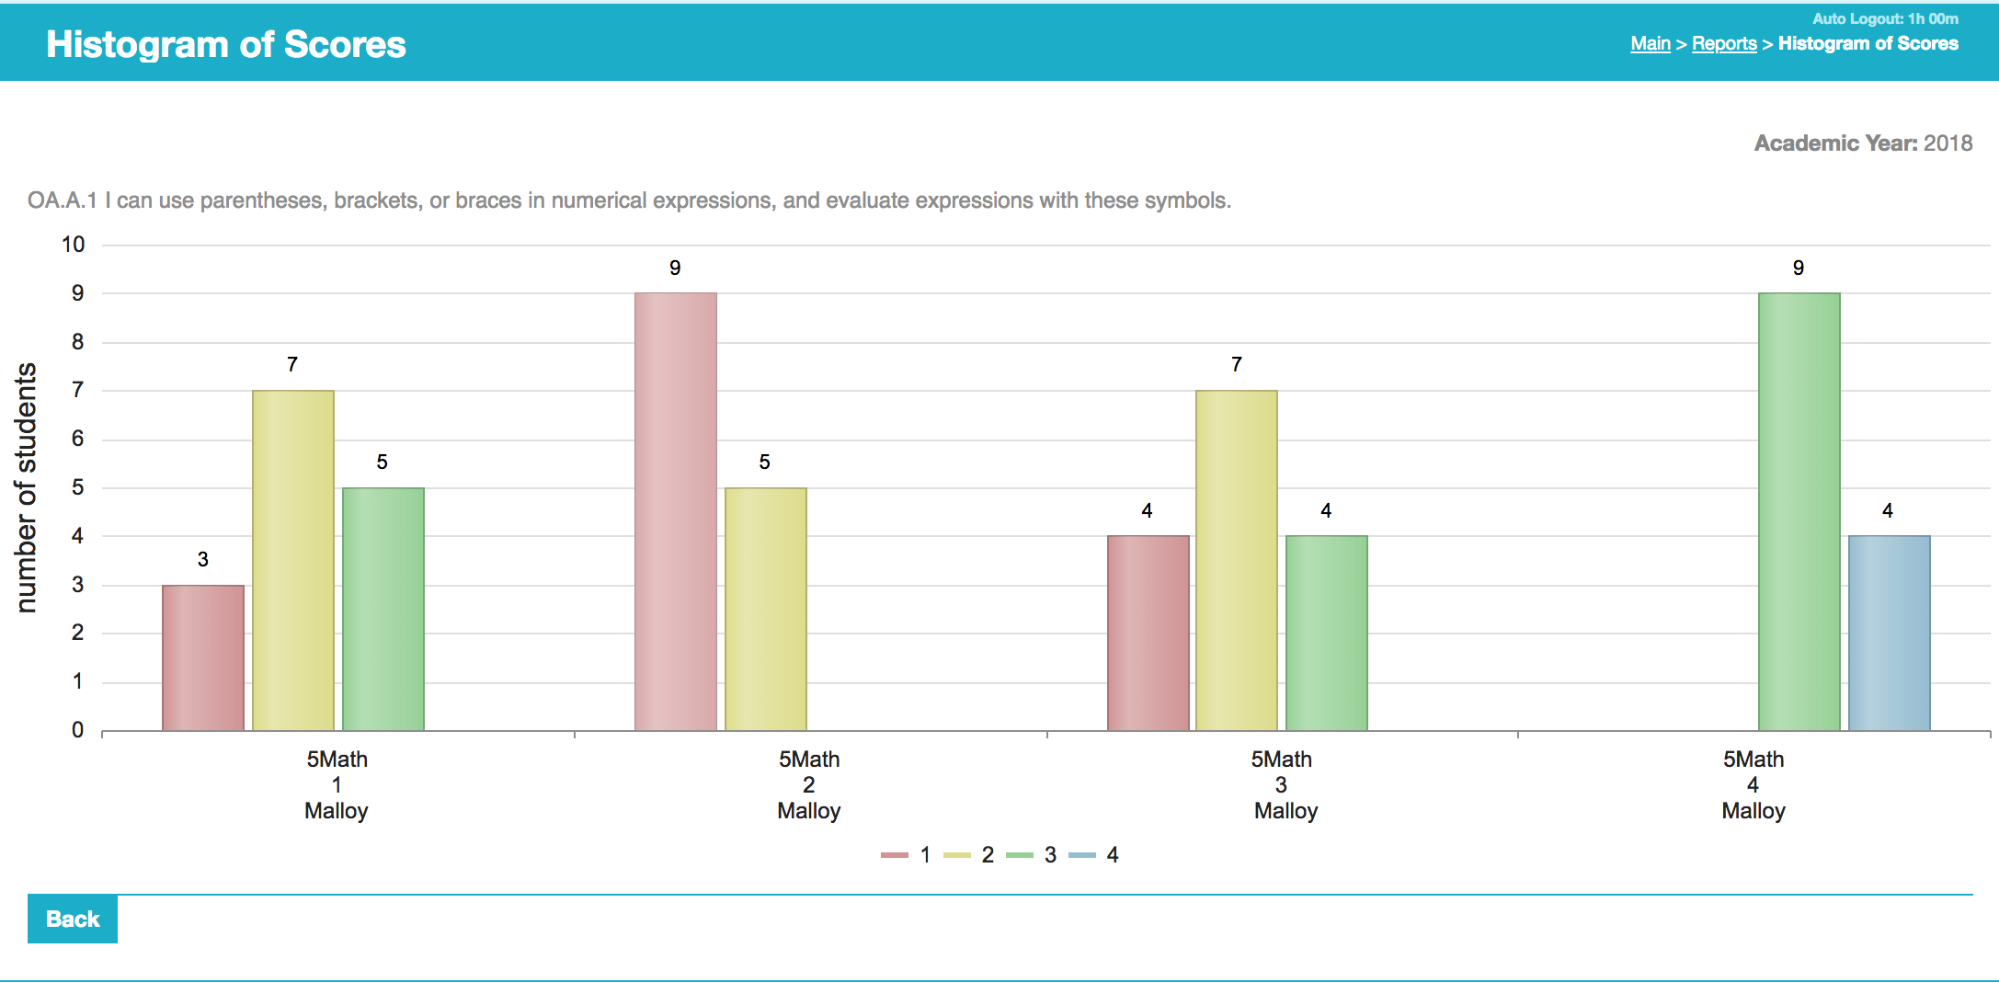
Use subgroups to make comparisons
Most organizations run multiple histograms, one for each unique subgroup. There are many ways to “slice and dice” data to tease out important insights. In the example, there's a histogram for each section. It’s easy to identify high performing sections (and teachers), that could help their peers by sharing their successful practices during professional development.
Use demographic data in analysis
Demographic data is frequently used for subgrouping. When generating multiple histograms, it’s often desirable to break down by gender, race/ethnicity, low income, homeless, IEP, 504, etc.
Run for all standards-based data or common assessments only
Users can choose to focus analysis on common assessment data, or include all assessments given in the classroom (using standards-based grading algorithms to combine multiple scores into representative mastery values). While common assessments generally provide more accurate data (due to greater investment in higher quality items), including all data can yield more timely results. It’s often helpful to get analysis earlier and develop action plans.
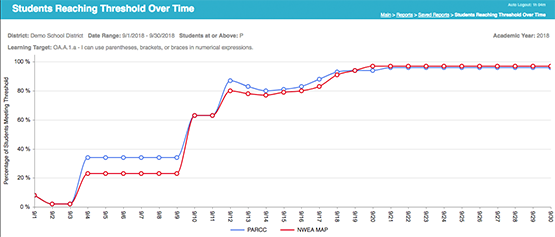
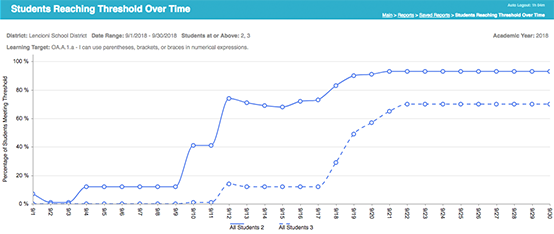
Learning trendlines
Another popular data visualization is the learning trendline, which shows learning progress over time. The default chart shows students at “2 or higher” and “3 or higher.” Curves rise over time as student learn. In addition to global usefulness, in the classroom it can identify highly effective lessons (which cause the curves to jump up). Subgrouping can be applied to yield many curves on a single chart. Using all data (not just summatives) provides finer granularity of analysis.
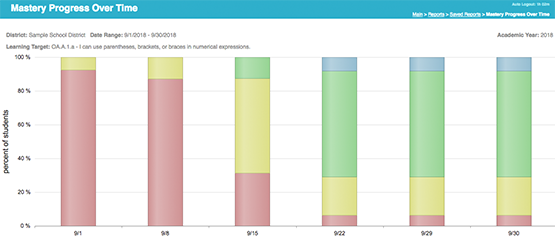
Mastery progress over time
Another visualization is mastery progress over time. This stacked graph is similar to learning trendlines. It shows the student scores as they grow and move between histogram buckets. This can also be run with subgroups.
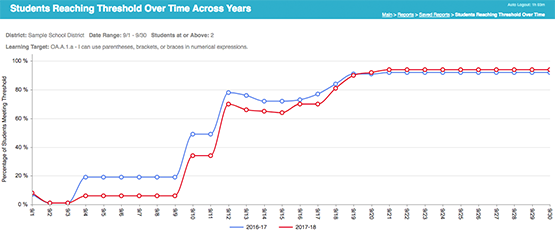
Track longitudinal performance
Performance over time can also be measured. Look at multiple cohorts performance over the same coursework. Also track a single cohort as it moves through grade levels.
Get results fast
One challenge with assessments has been the lag to receive data from external testing services. The delay restricts the ability to use the data in a useful way. Analyzing common summative data with TeacherEase allows teams to get actionable results quickly.
Generate actionable plans
Once teaching teams have timely results, they can develop action plans for students. Identify students in need of additional support and help them make progress. This is especially useful if the analysis is aligned to your curricula.
Assess the impact of instructional changes
Good analysis software and a mature learning data set allows districts/schools to evaluate the performance of new instructional practices. If you make changes, it’s easy to see whether student learning goes up or down. Once you can measure it, you can manage it.
Teachers can use formative assessment data in their classrooms
Individual teachers can use better data in the classroom too. Help them to make thoughtful instructional decisions based upon learning data, rather than mechanically following a curricula.
Inform instruction
Instruction should be responsive to student learning. Teachers need data to make conscious and effective choices. For instance, if an introductory lesson worked well, she may want to move onto a large group intermediate lesson (with support for the few students who didn’t “get” the first lesson). If not, then a reteach of introductory concepts would be more valuable. The classroom will likely break into smaller groups to meet individual student needs.
Easily form dynamic groups
Once teachers have mastery data, a natural extension is to give students work appropriate for their current level. Analytics in the classroom can easily suggest dynamic grouping for students. Teachers can give independent work for each group, and cycle between the groups to support their efforts.
Tightly integrated with rest of TeacherEase
TeacherEase provides a complete software platform to support standards-based learning. The data analytics tools are integrated with other modules like assessments, gradebook, and report cards. Having one integrated place to store and analyze data helps the organization become more effective.
Learn More about TeacherEase
TeacherEaseWant to Talk?
Request Demo